SITCOMTN-081
Oscillations in the hardpoint forces of M1M3#
Abstract#
This technote describes oscillations seen in the M1M3 cell hardpoint forces, these events are particularly important to understand in order to certify that the glass was safely installed on the M1M3 mirror cell, it’s important to verify any vibrations that could potentially damage the mirror. In this technote we discuss a few types of oscillations:
Oscillations During Slews
identification of events: SITCOMTN_81_identify_oscillations_during_slew
events caused by azimuth topple blocks: SITCOM-1390_topple_block_vibration
events with unknown cause: SITCOMTN_81_characterize_oscillations_during_slew
Strong Continuous oscillations: SITCOMTN-081_strong_vibration_analysis
Oscillations due to an earthquake (link to notebook, no m1m3 data)
The data analyzed in this technote is mainly made up of events during the dynamic testing of M1M3 in the second half of 2023. The relevant requriements are
LVV-11306: All vibration sources from the mirror support system combined SHALL not produce more than +/- 0.38 micron of mirror piston motion, +/0.23 micron of mirror decenter and +/ 1 e-6 degree of mirror tilt (RMS values) (see document-7271).
For repeating oscillations we want the amplitude of oscillations be less than 400 N. This is the requirement for the mirror safety for 100,000 cycles. See disscussion under Glass Safty Criteria Number 4 (GSCN4) in this confluence page.
A summary of the analysis in this technote can be found in the below table.
Type of Hardpoint Oscillation |
Amplitude [N] |
Repeating |
Cause |
Requirements [N] |
|---|---|---|---|---|
Azimuth Slews |
~500 |
Yes |
topple blocks |
< 400 |
Elevation Slews |
### |
Yes |
Unknown |
< 400 |
Strong continuous oscillation |
### |
No |
control software |
< 3000 |
Earthquake |
No M1M3 Data |
Yes |
Mag ~6 earthquake |
< 3000 |
Introduction#
To ensure glass safety and the safety of all the components of the Vera C. Rubin Observatory it is imperative that the system is stable and does not expierence any large oscillations or activate any resonance modes during operations. In order to verify the safety of the as build system, we must investigate any identified oscillations. In this document we present a few of these investigations that include regularly seen oscillations during slews in both azimuth and elevation as well one time events due to problems in the control software or environmental effects such as earthquakes. The structure of this technote is as follows, first we discuss regularly seen oscillation events during a slew. This includes the identification and characterization of these events as well as possible causes. Then, we present a select set of other one time oscillation events that occured outside of normal operations.
Oscillations During Slews#
Identification of events#
Re-occuring oscillations in the M1M3 mirror cell + mirror system were identified, initially, through visual inspection of the measured forces on the hardpoint actuators during a slew.
These hardpont force telemetries can be accessed in the EFD under the table lsst.sal.MTM1M3.hardpointActuatorData with the columns starting with measuredForce.
After the inital identification of a subset of these events we developed a heuristic method to more systematically search for them.
We compute a rolling standard deviation of the measured force on each of the six hardpoints using a 2 second window.
Then, we flag all times where the rolling standard deviation was above 100 N.
Next, for each hardpoint individually peaks within 2 seconds were accociated into a single detection in order to only flag once on each potential oscillation event.
Finally, we used a 4-second window to combine detections across hardpoints only keeping events that are detected in more than 4 of the hardpoints.
This method, is fairly complete in flagging oscillitory events, but reqires a fair amount of visual inspection to remove false positives.
An example of how oscillation events are identified is shown in figure 1.

Fig. 1 Chronograf screenshot of elevation torque during oscillation event.#
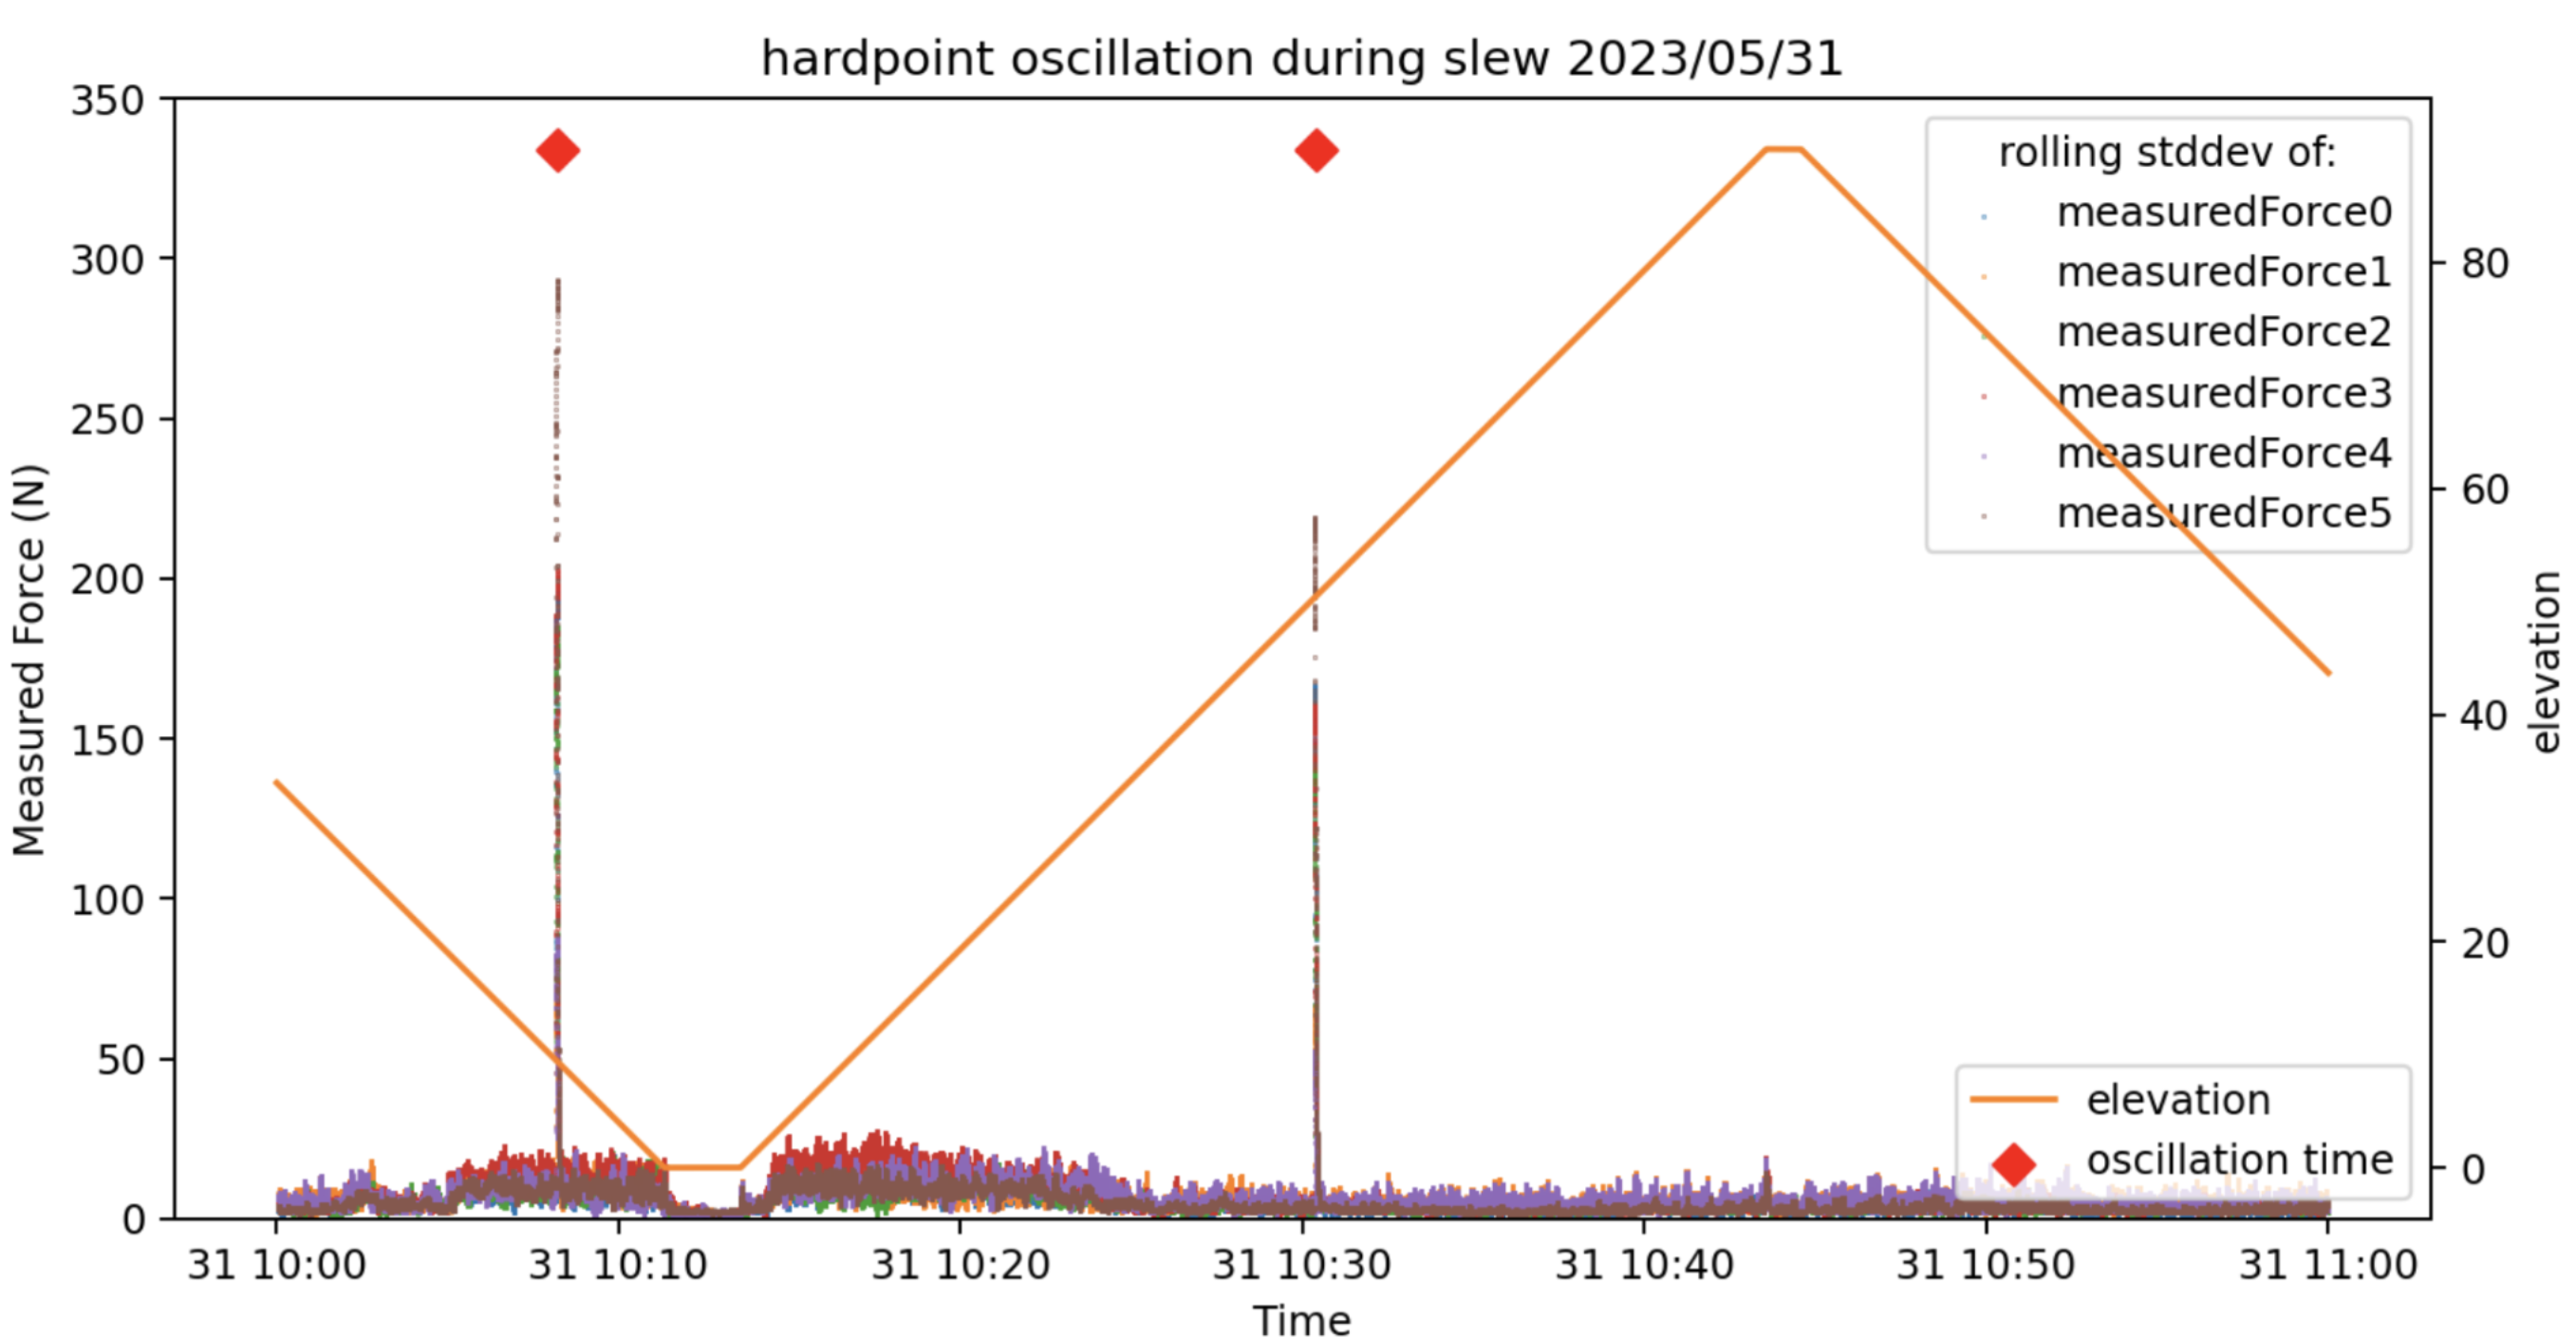
Fig. 2 This figure shows the elevation of the TMA (Telescope Mount Assembly) as an orange line, the colored points show a rolling standard deviation of the hardpoint measured forces (0-5). Oscillations are initially flagged as times during a slew with large peaks in the rolling standard deviation of at least 4 of the hardpoint forces. The red diamonds in this plot note two of these flagged events.#
The next two subsections describe the classes of events that we discovered using this identification process.
Events during azimuth slews: vibrations due to the topple blocks#
There are two topple blocks at az -70 and az -50 to detect the direction of the rotation in azimuth and act as a limit switch preventing the TMA from slewing in one direction over the maximum angle of its rotation. As the TMA slews in azimuth it hits the topple block and flips it, this contact generates vibrations in the full system that we have analyzed.
We were able to identify and associate this class of events due to a number of azimuth only slews on on November 29 2023. Below we show a histogram of the aizmuth angle of the telescope when vibrations were detected.
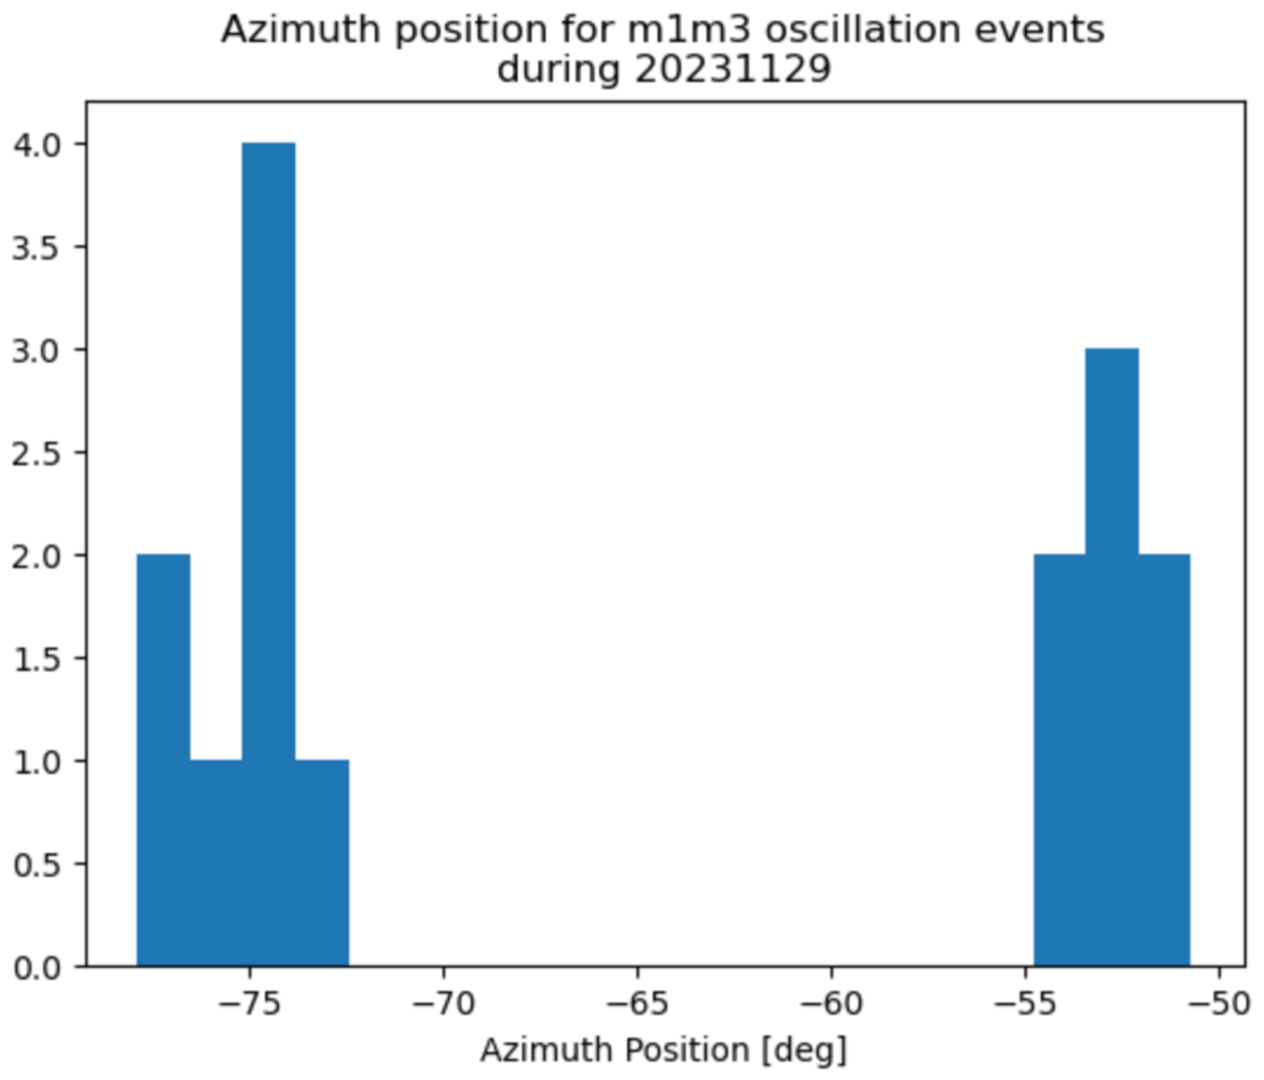
Clearly these vibrations only occur around two aizmuth locations centered on -70 and -50. These positions roughly match the actual locations of the topple blocks. The spread in angle is due to the direction the TMA is rotating and the postion of the topple blocks when the collision occurs. Therefore there is a range of a few degrees from the center of the topple block where the events can occur.
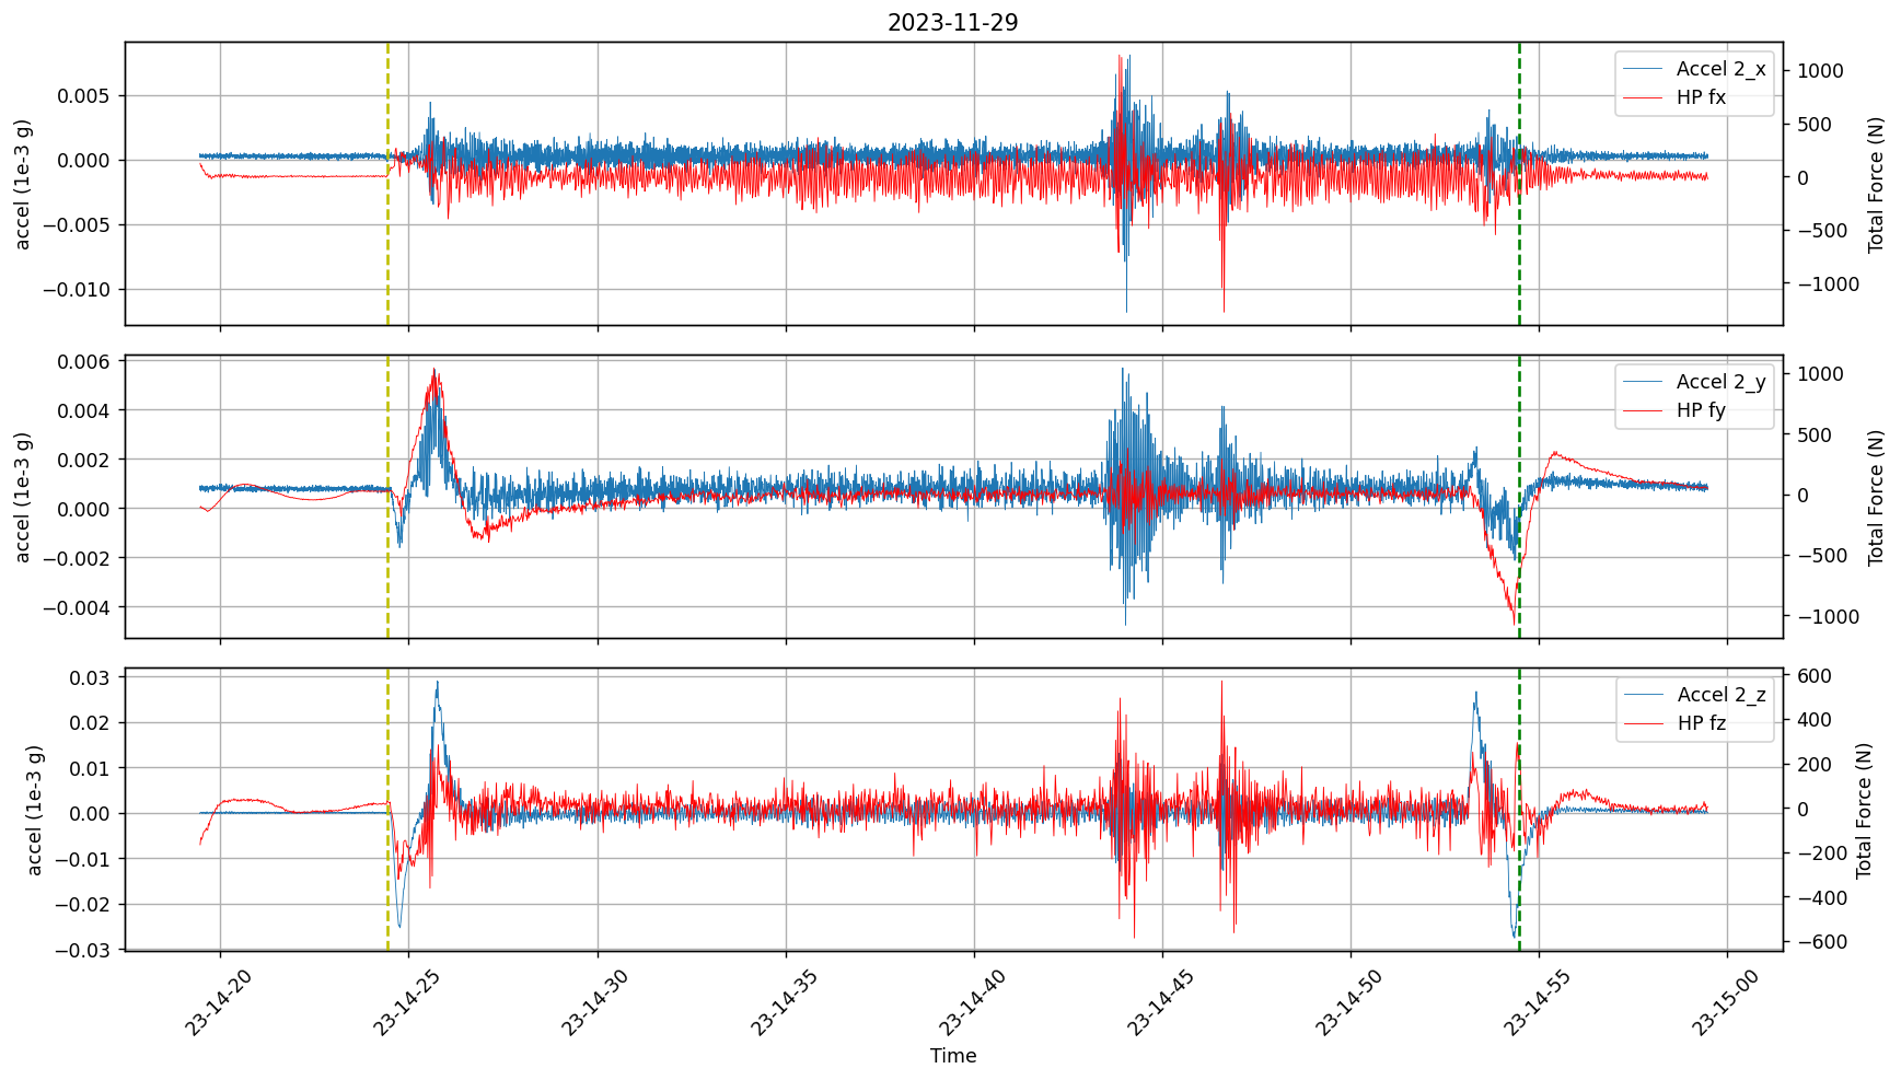
The following plots show one such vibration event while TMA was moving in azimuth from -25 to -125 degrees.
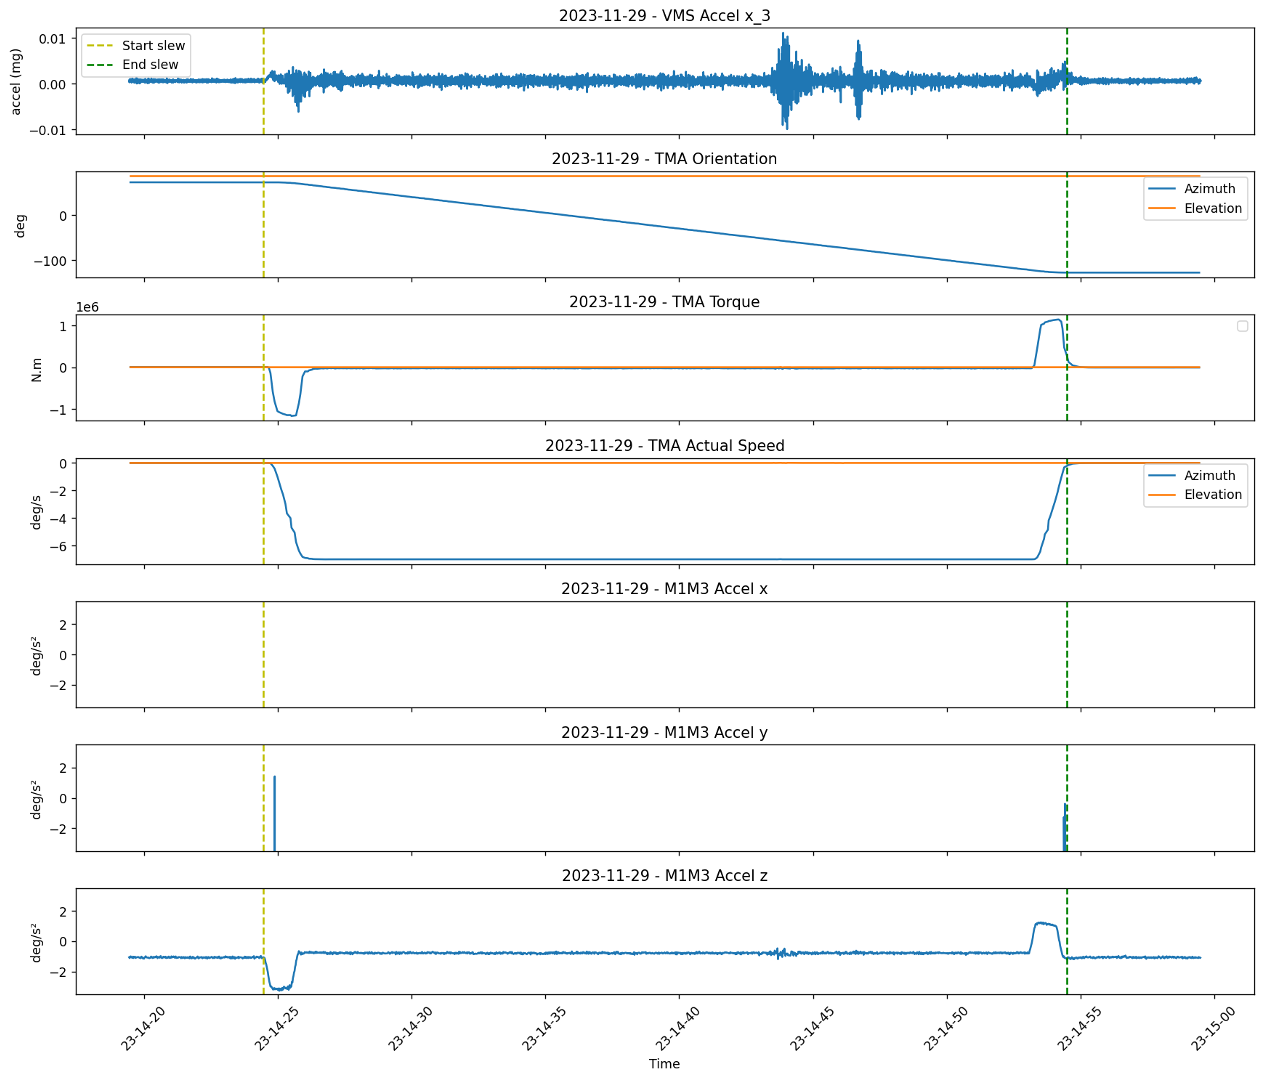
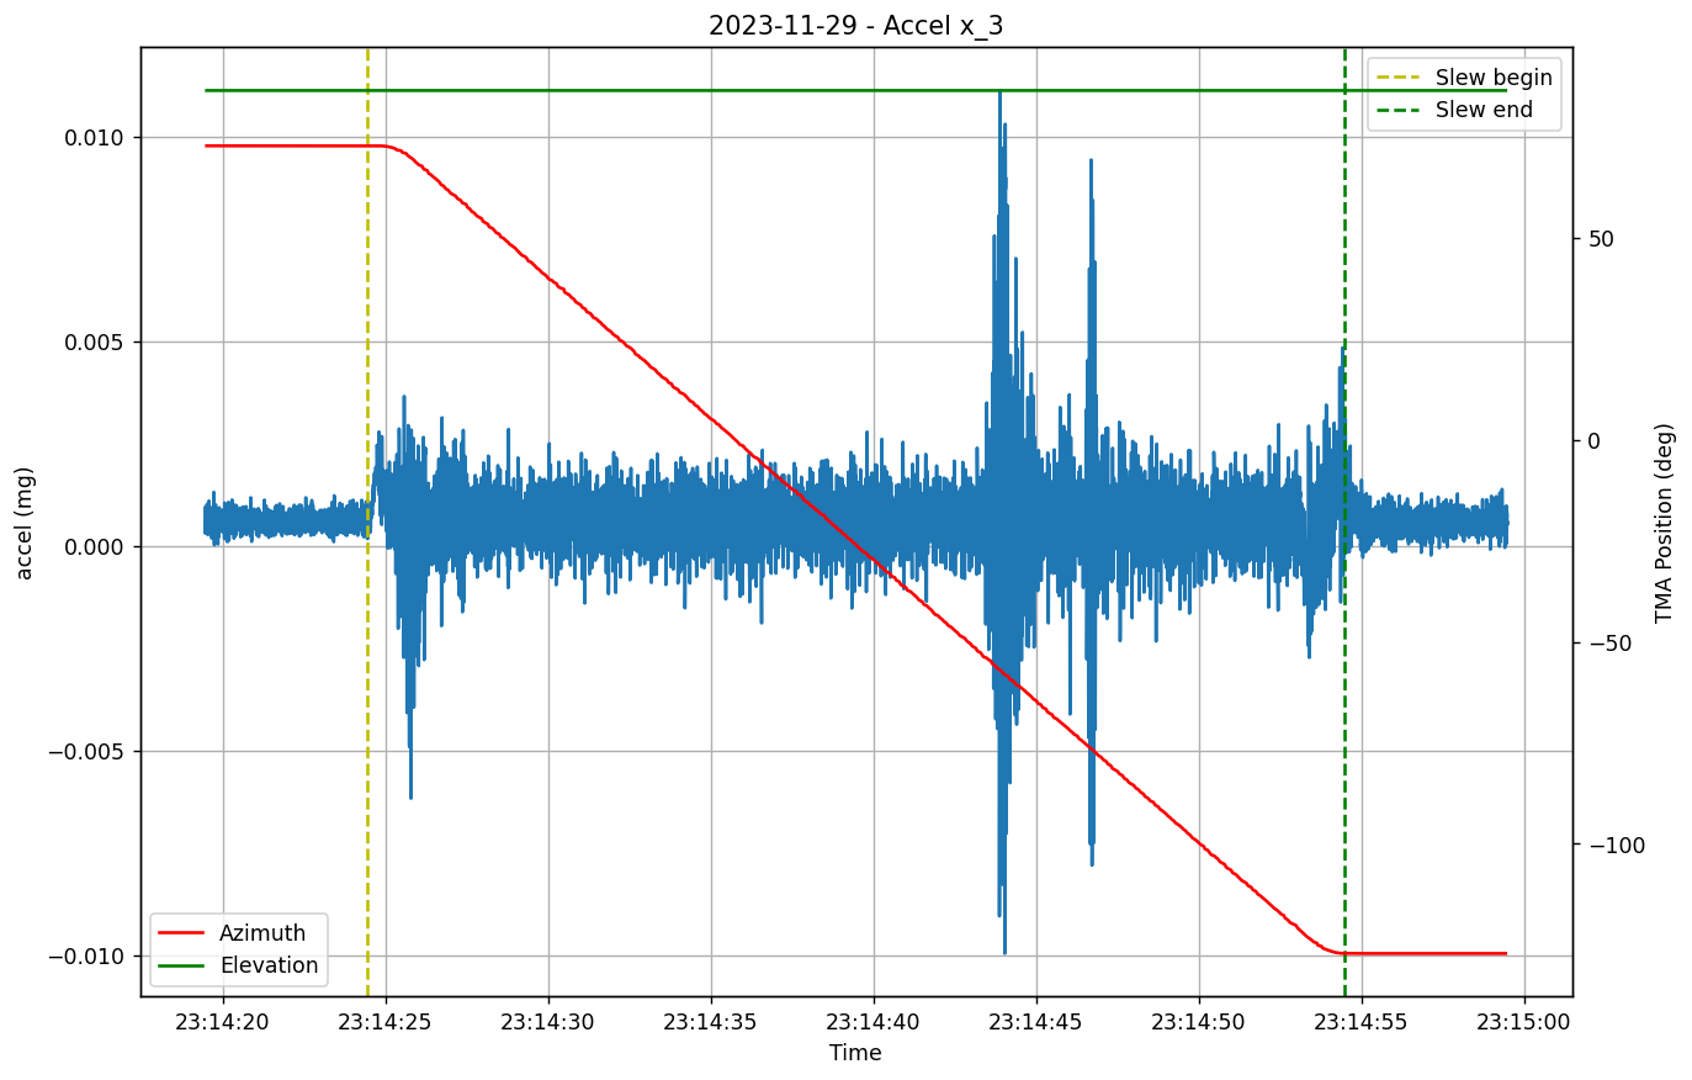
This vibration itself “during” the slew doesn’t affect the settling time or other specifications, but the forces seen on the hard point are felt by the glass and could have detrimental effects.
Here we show a plot of the total hard point forces Fx, Fy, Fz and TMA acceleration during an event.
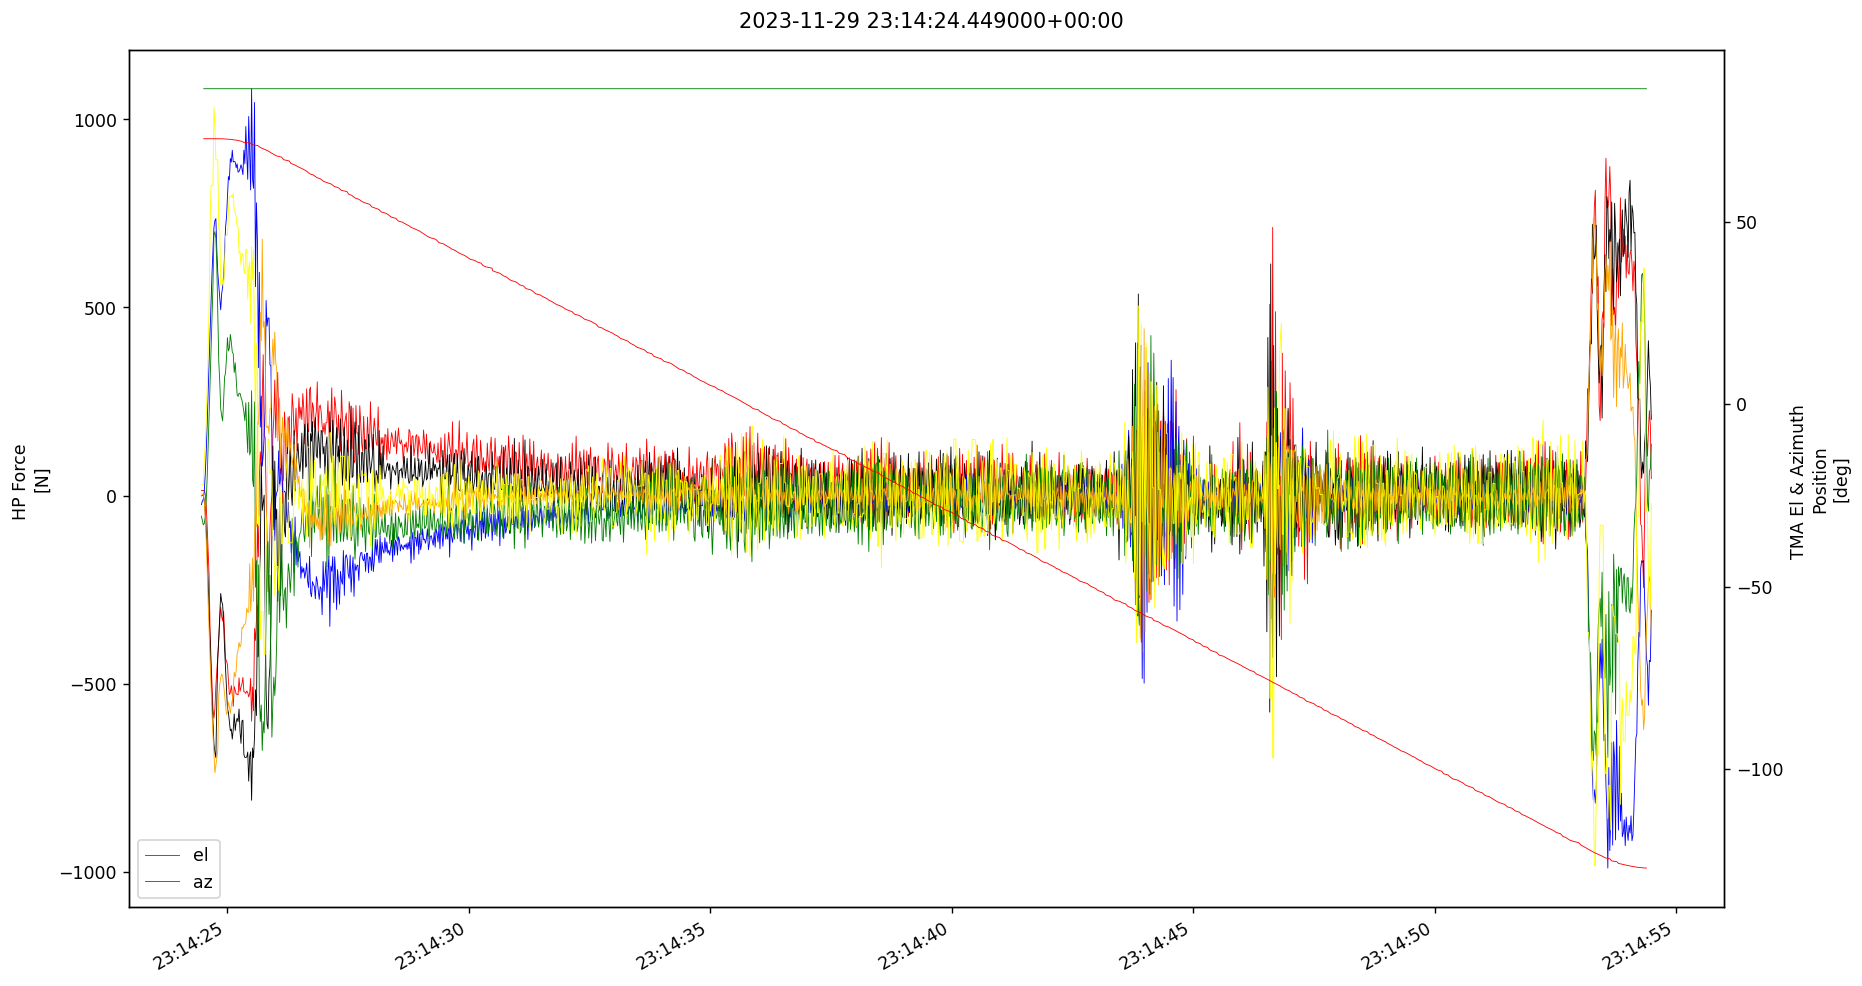
The plot below shows and example of the measured forces on each of the 6 hardpoints from November 29 2023, where the amplitude of the vibrations seems to be more than 500 N.
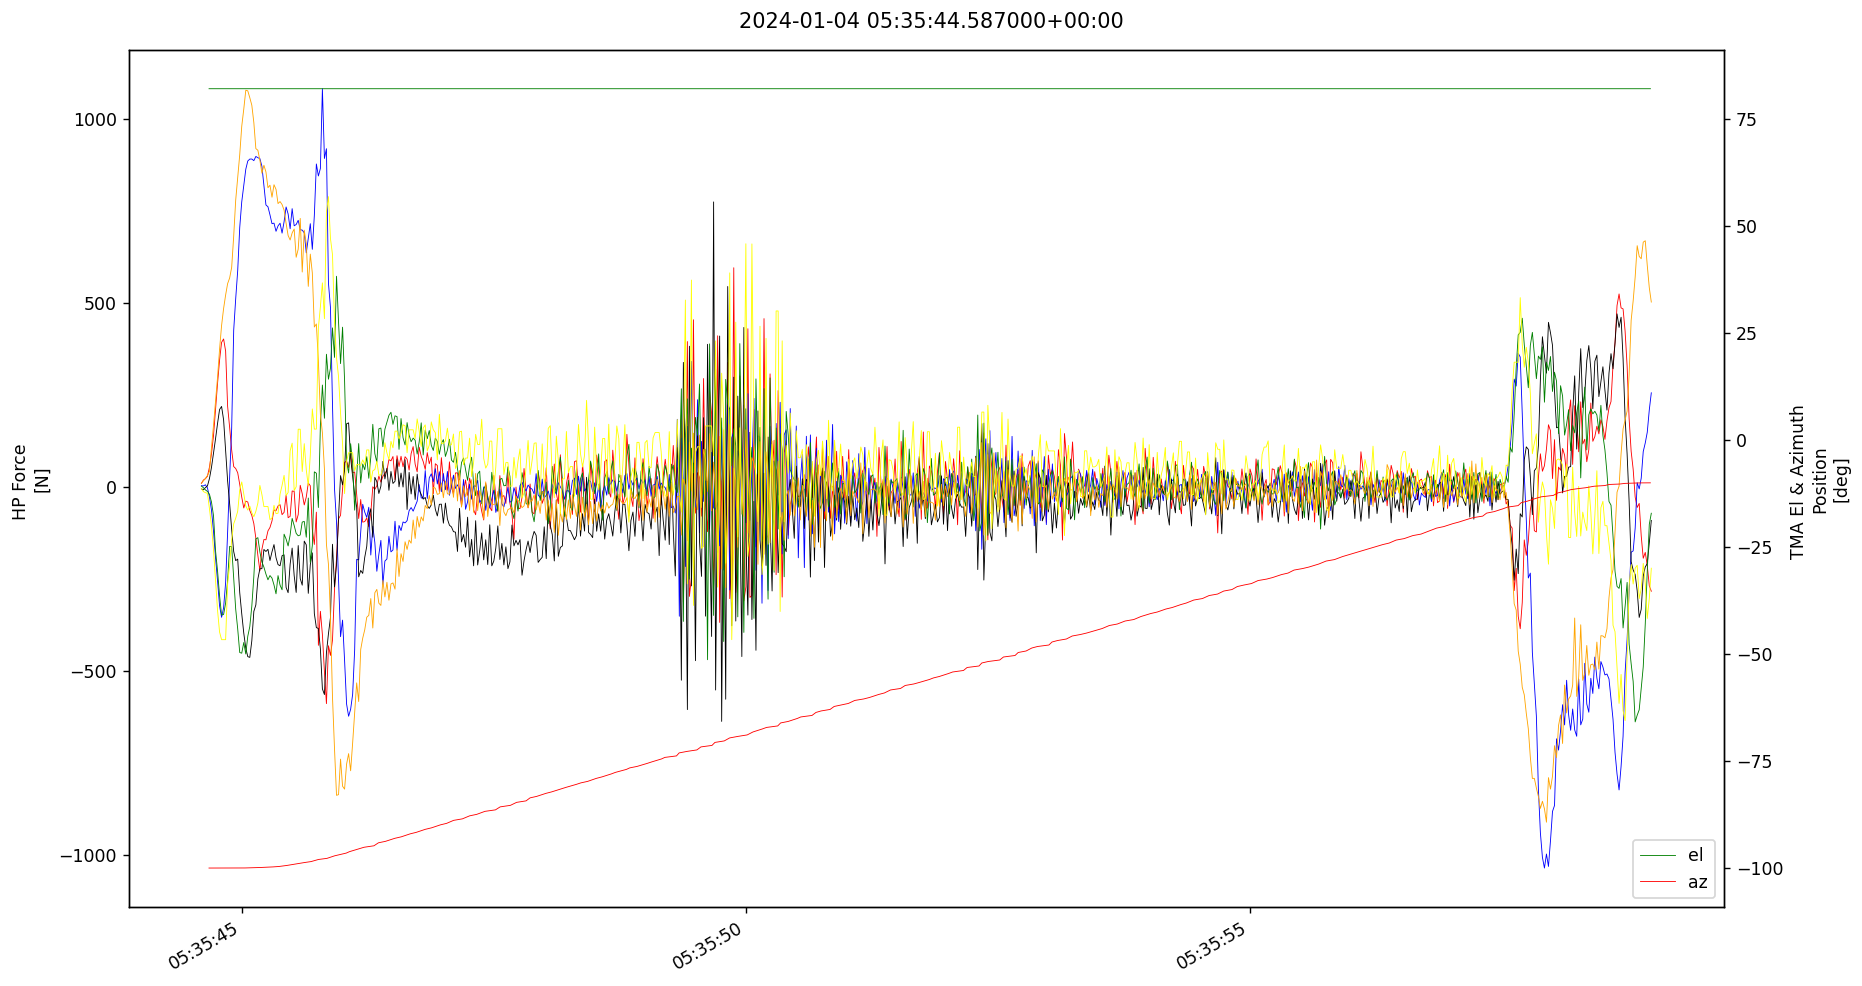
Next, we show the same plot for an event on January 01 2024 where according to the comment on Slack that it was improved (Slack message link)
On April 04 2024, we repaired the TMA topple block shock absorber (SUMMIT-8775), but there is no M1M3 data on TMA after that.
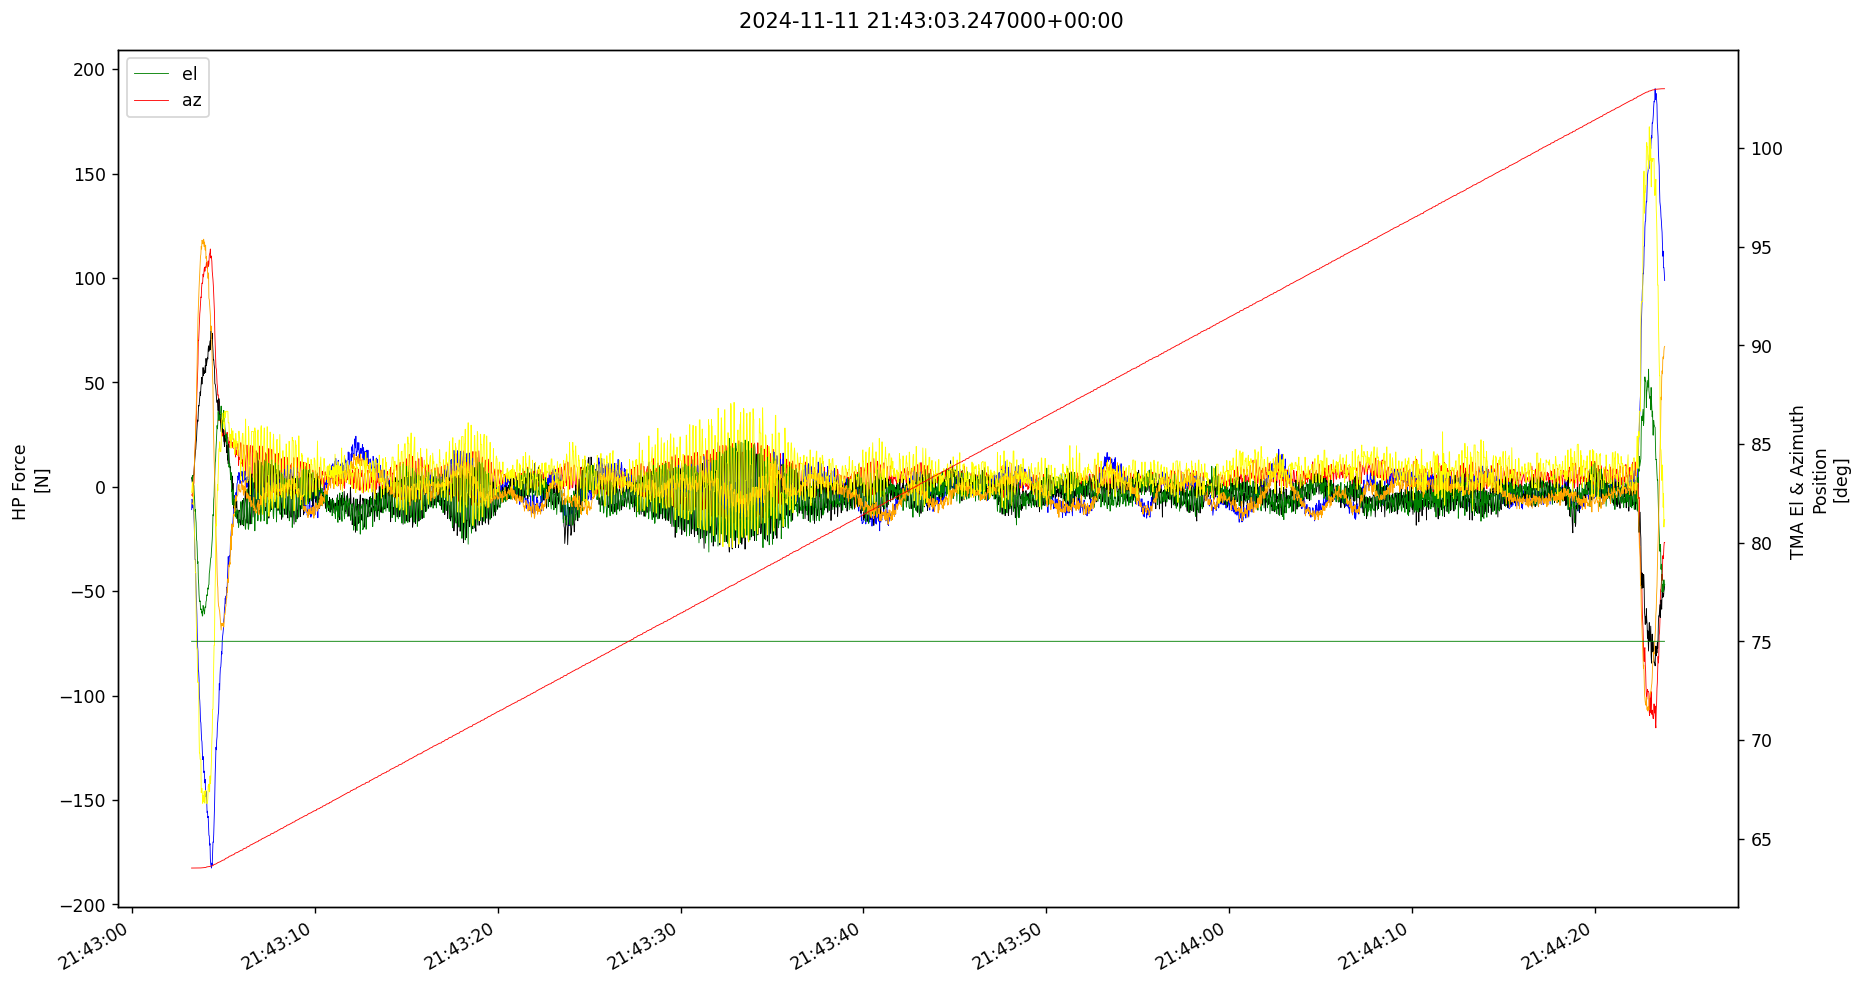
On November 11 2024, we tested the TMA with 5 % speed, and the HP forces when passing the topple block, are below 50 N. It doesn’t show the mirror safety yet, but we can say the vibration during the tracking won’t affect the image quality.
Events during elevation slews: unknown cause#
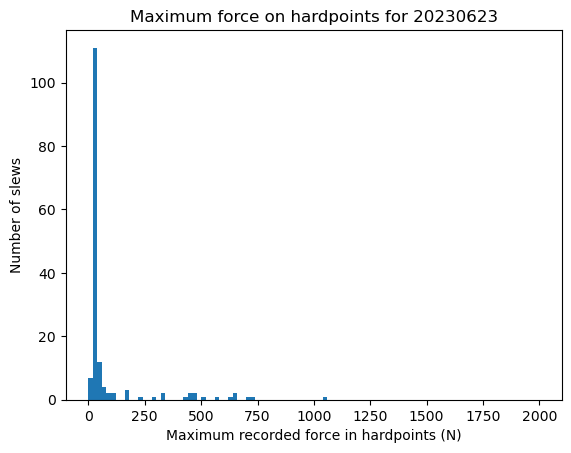
During the period from April 2023 to June 2023, several tests were performed consisting of elevation only slews that showcased small oscillations.
Currently, (September 2024) the origin of these are unknown but they do not seem to compromise the hardpoint limits.
Some examples are shown in the following plots.
In all cases, it is required that the MTM1M3.logevent_detailedState is ACTIVE or ACTIVEENGINEERING, corresponding to hardpoints being active (mirrors ‘raised’).
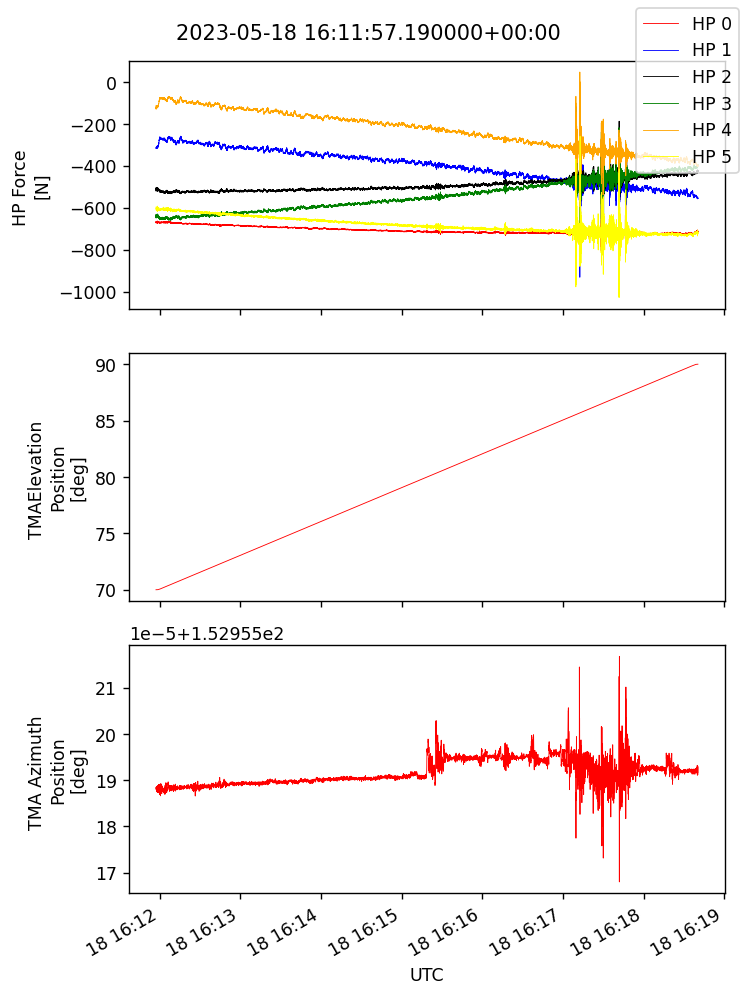
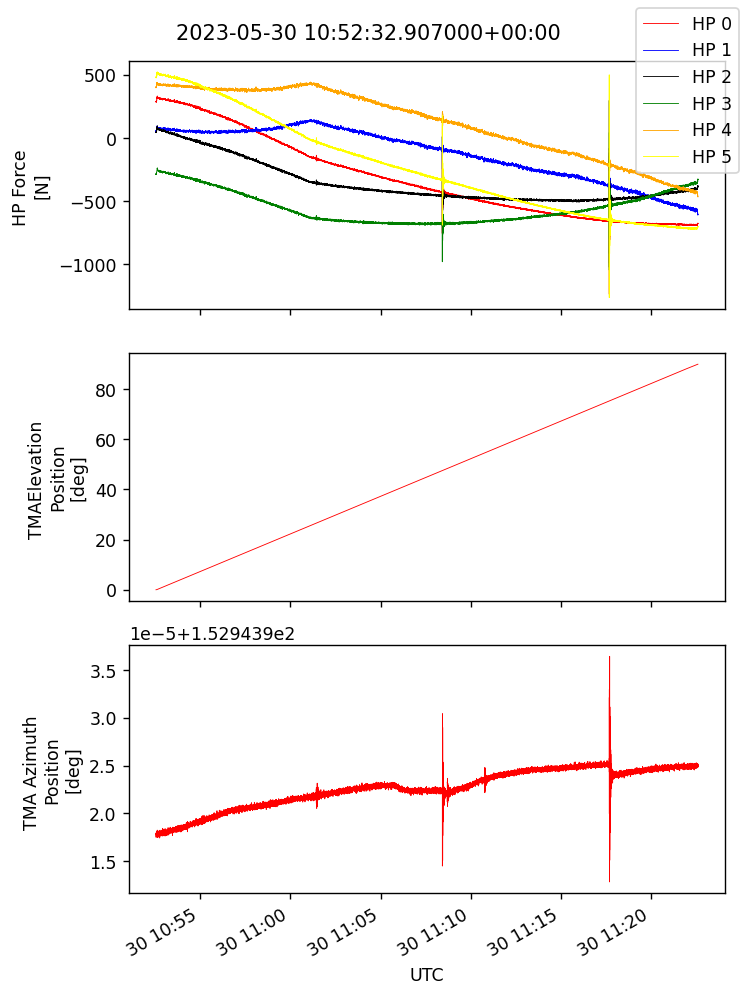
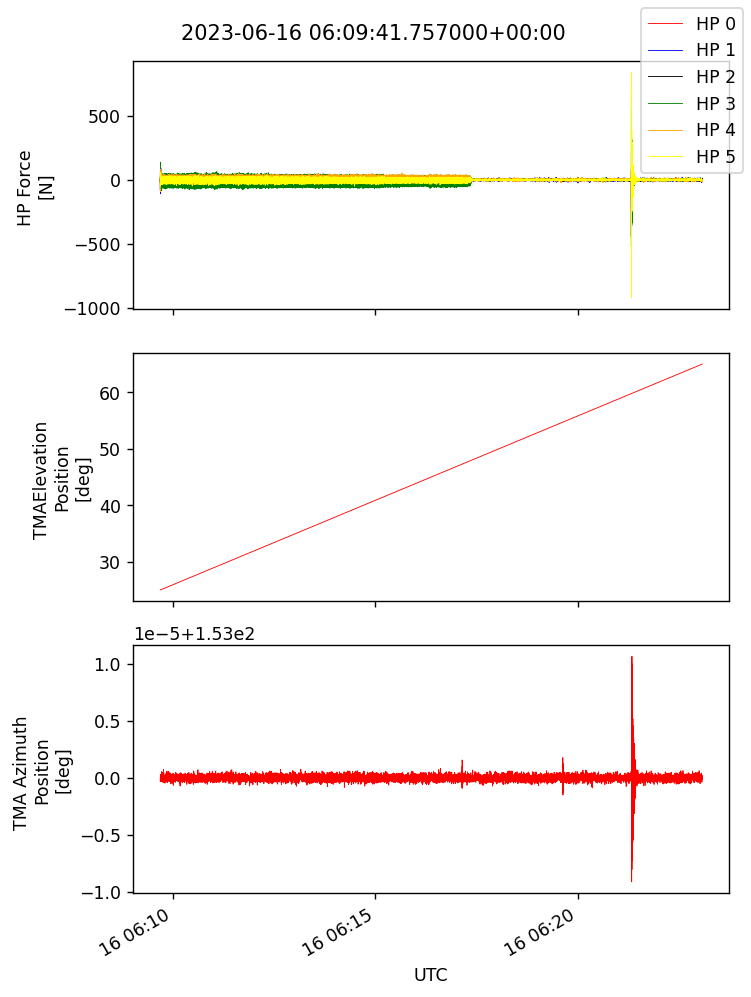
A typical distribution of maximum force on any individual hardpoint for the slews in this period looks like this:
Strong continuous oscillation#
Summary of event#
On June 27th, during M1M3+TMA integration tests, observers noticed a powerful vibration on the TMA and M1M3. The observers described noises similar to hammers hitting metal plates. This was the only time such an event happened. A summary of the event is as follows:
the gateway tests were completed at 5% speed (Block 34).
during a slew the strong vibrations started at 2023-06-28 01:08 UTC and lasted 12 minutes until 01:20 UTC. These vibrations were driven by the TMA elevation drives, not another subsytem.
In response, the force balance system was disabled and the mirror was lowered.
More details can be found in the test log (2023, 06, 27 - M1M3 Test Log), and jira ticket SITCOM-1089. It is thought that this event occurred because the TMA was slewed/homed with the force balance system on, subsequently the control software was changed to not allow this state in the future. But, this event gives us the opportunity to understand how large vibrations will affect the M1M3 cell. In particular, we wanted to understand if the TMA driven oscillations could resonate with the M1M3 force balance system and cause a positive feedback loop, leading to an increase in the measured forces on the mirror.

Fig. 3 Chronograf screenshot of elevation torque during oscillation event.#

Fig. 4 Zoom in of oscillations showing periodic behavior.#
The above images show the TMA torque behavior during this event. The 12-minute duration can be seen with a peak to peak amplitude of ~500k Nm (+/- 250k).

Fig. 5 Chronograf screenshot of hardpoint forces during event.#
The above image shows the hardpoint forces, it can be noted that the event starts at 01:08. To begin with the mirror was raised with the force balance system was active, then at 01:11:15 the force balance system was deactivated, starting at 01:11:45 the mirror was lowered and it reached the static supports at ~01:15:15. If the M1M3 cell had any positive feedback during the event, we would expect the amplitude of the hardpoint measured forces to change with time. Or we would expect the observed frequencies of the oscillation to change with the state of the M1M3. Based on the measured force image above the amplitude is roughly constant for each state of the mirror, and the mirror did not break away. There is no correlation between the TMA oscillation and the hardpoints behavior in the same period.
Below we show a Power Spectral Density (PSD) of the event computing it for the total event, and each of the different states of the M1M3 during the event. We see no evolution of the vibrations during the state changes of the M1M3 cell. From this we conclude the cell was driven by the TMA but did not contain any positive feedback or coupling with the TMA, for this event.
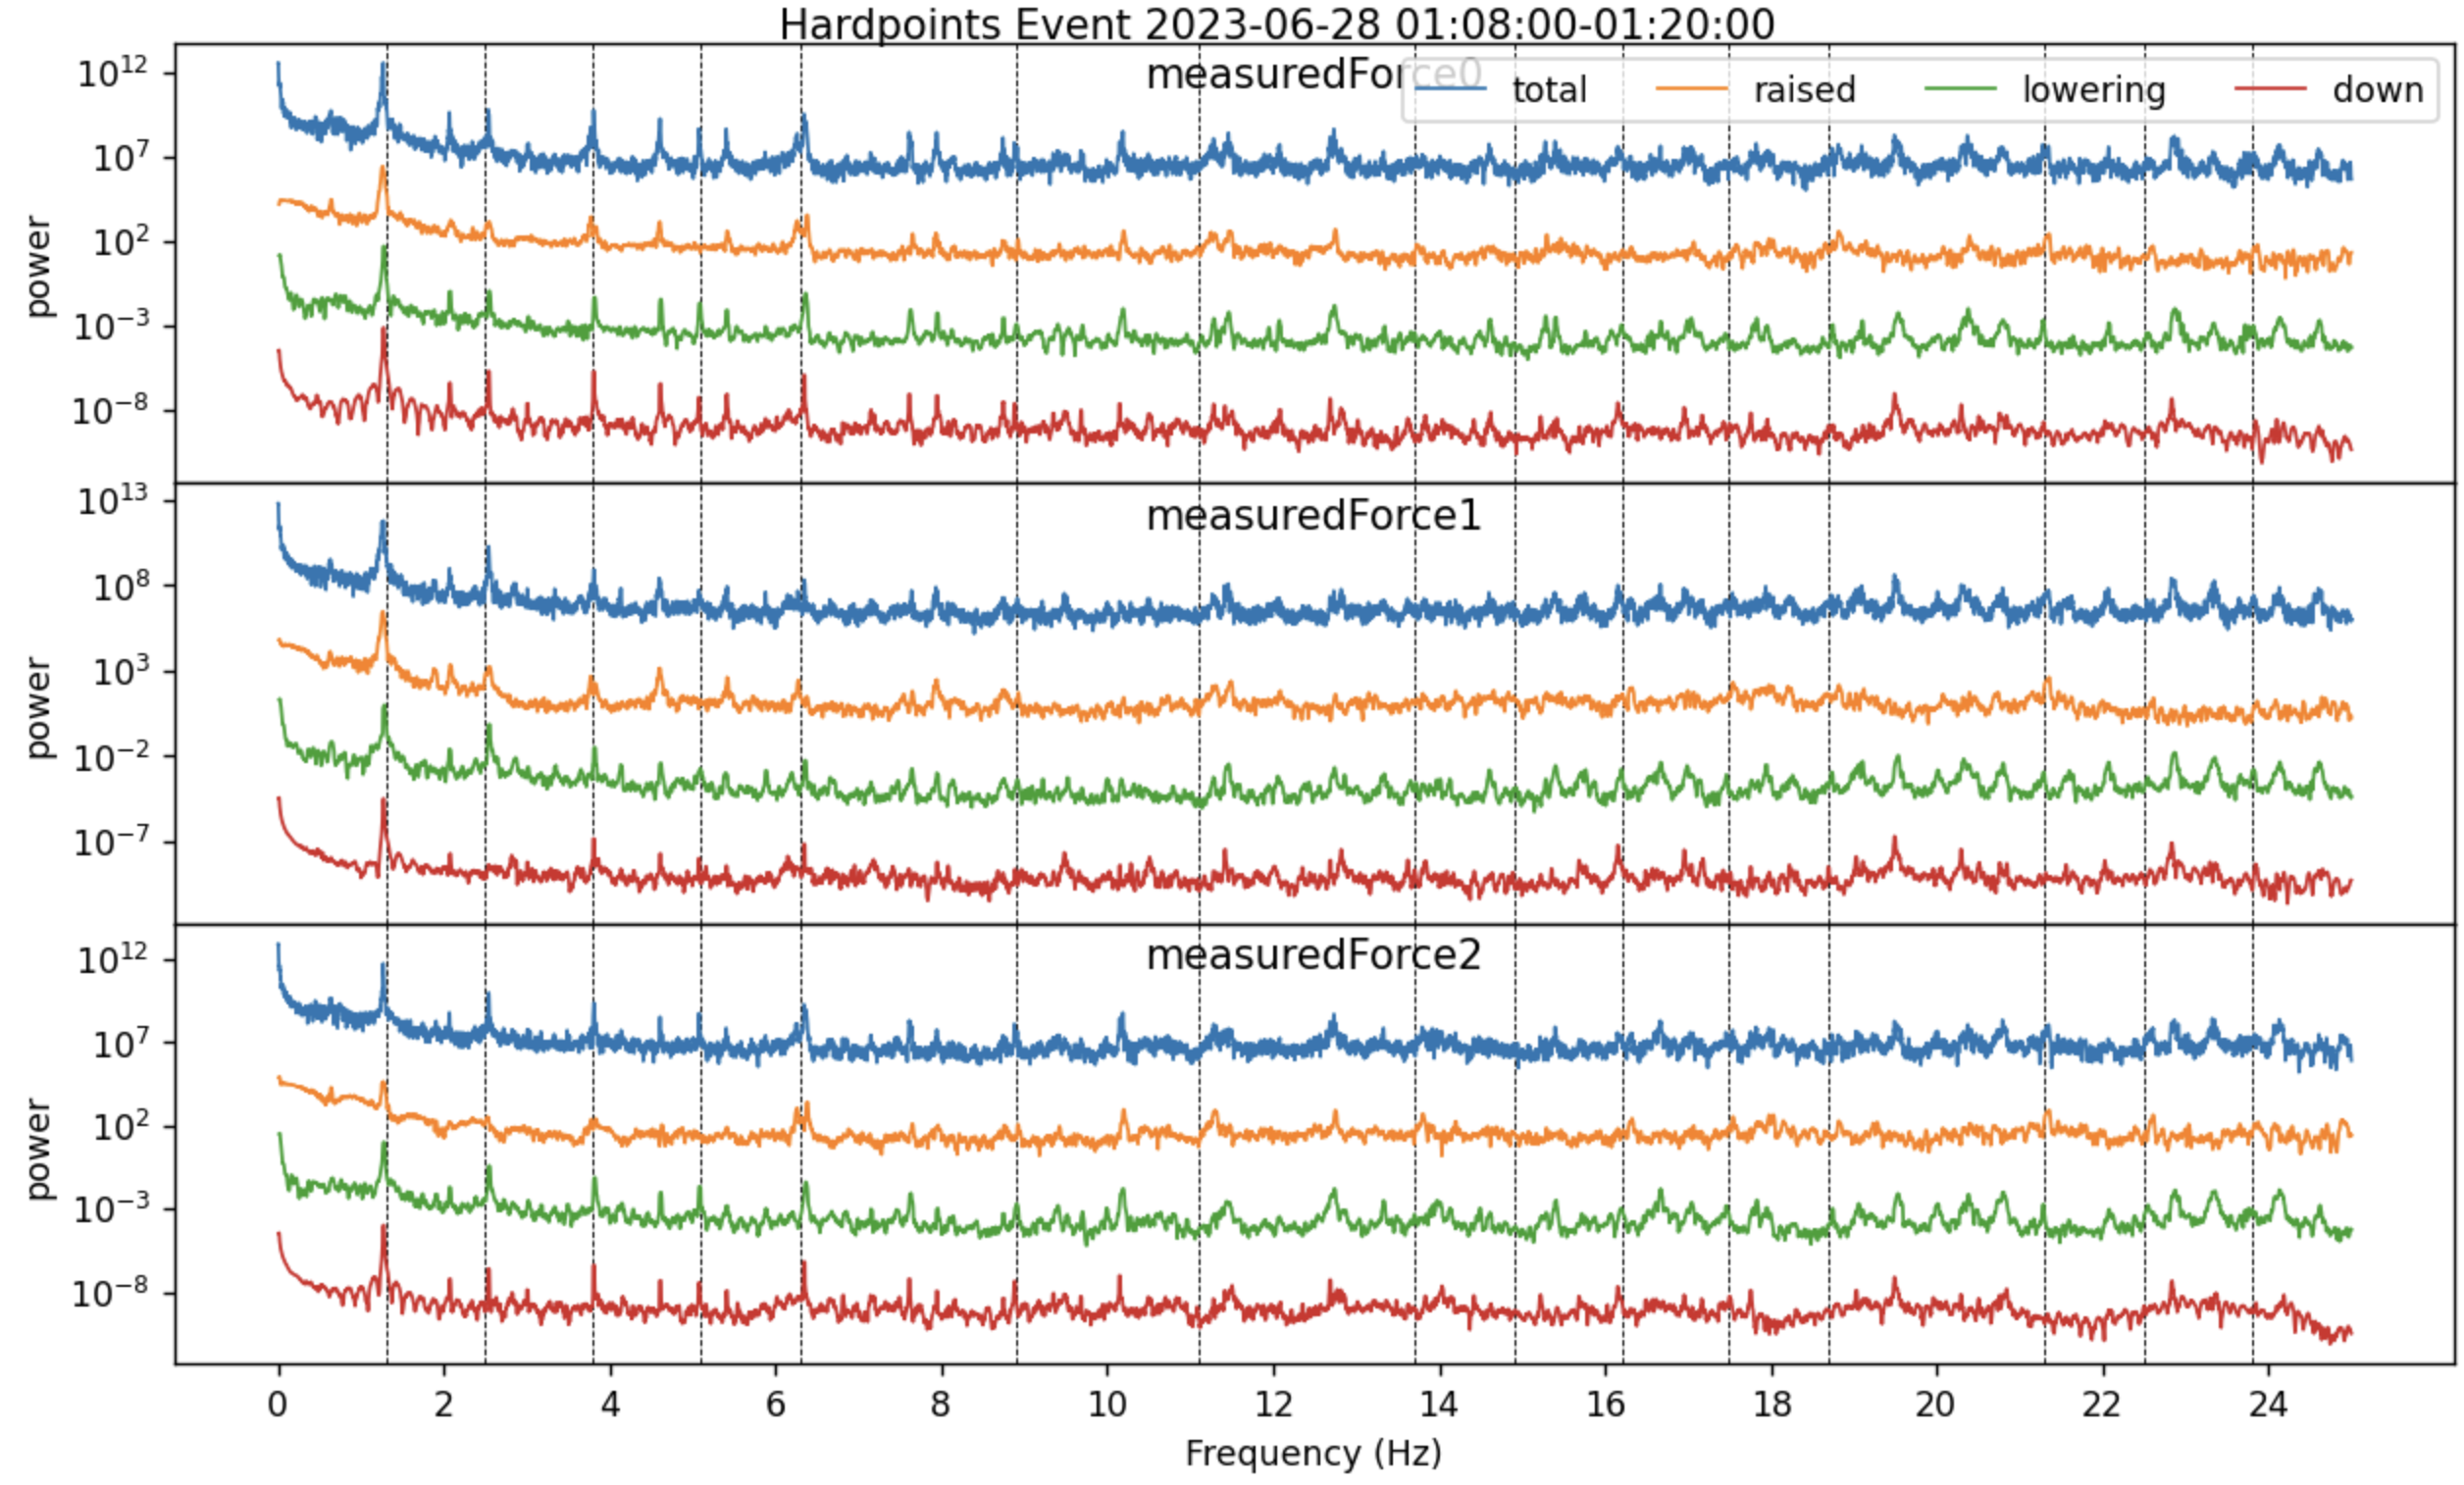
Fig. 6 PSD of hardpoint forces for 3 of the hardpoints showing no evolution with M1M3 state (different colored lines). The black vertical lines show the vibration peaks identified in the TMA torque. It can be seen that there are a few vibration peaks in the hardpoints not seen in the TMA torque.#
Earthquake Response#
We study whether the mag~6 earthquake events are safe for the mirror. There are two dates with large earthquakes:
2023-09-06 23:48:15 UTC
2023-10-31 12:33:43 UTC
Analysis for the evening’s event: 2023-09-06#
Acceleration#
1.1. Total acceleration telemetry for each of the 3 m1m3 vms channels:
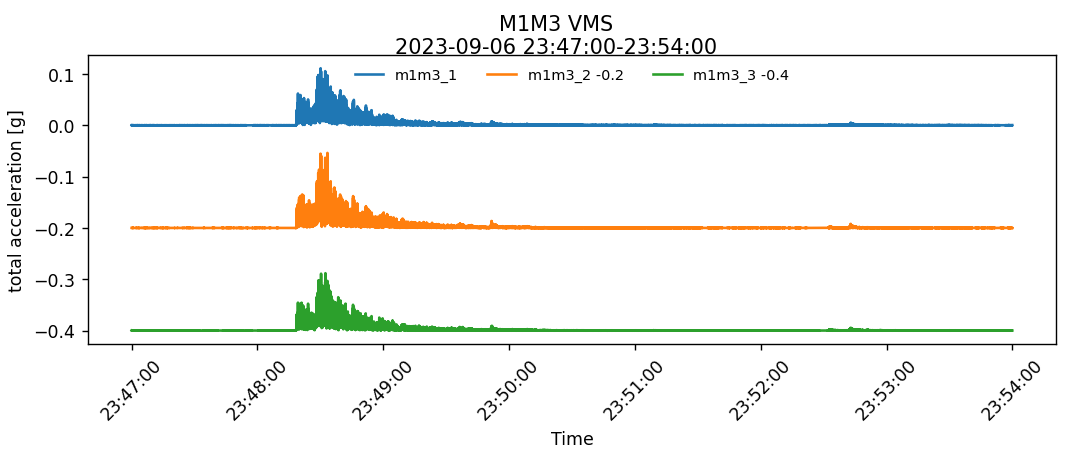 It is easy to visually determine the moment when the earthquake begins and the movements are recorded.
1.2. Plot of total acceleration telemetry (with an offset) of each axis (xyz) of each channel of the m1m3 vms channels:
We analyze each of the channels separately and in the three axes. In case we could see if one of the axes is more affected than the others.
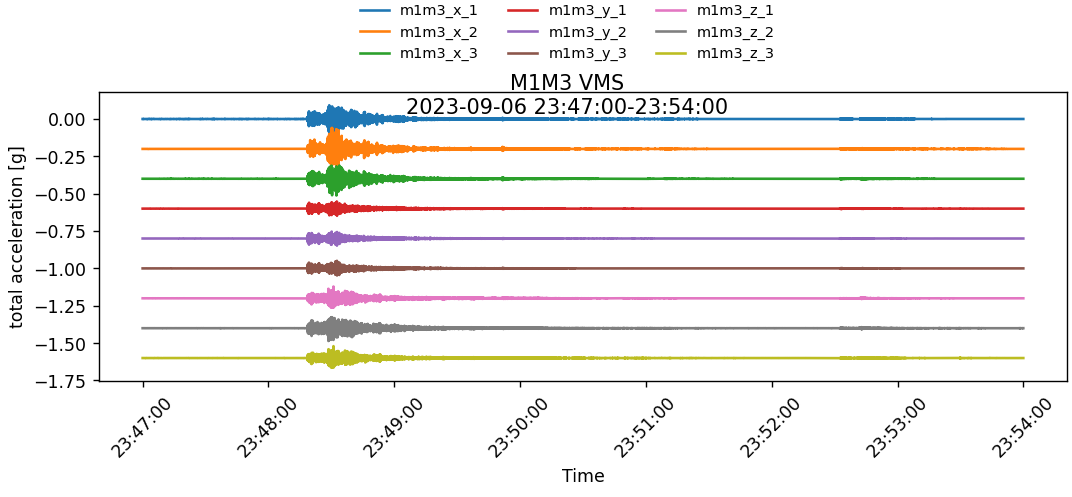
1.3. Plot of total acceleration telemetry (with an offset) of each axis (xyz) of the m1m3 vms channels:
Now we combine the different axes (x,y,z), where we can see that the x axis is the most affected by the earthquake movements.
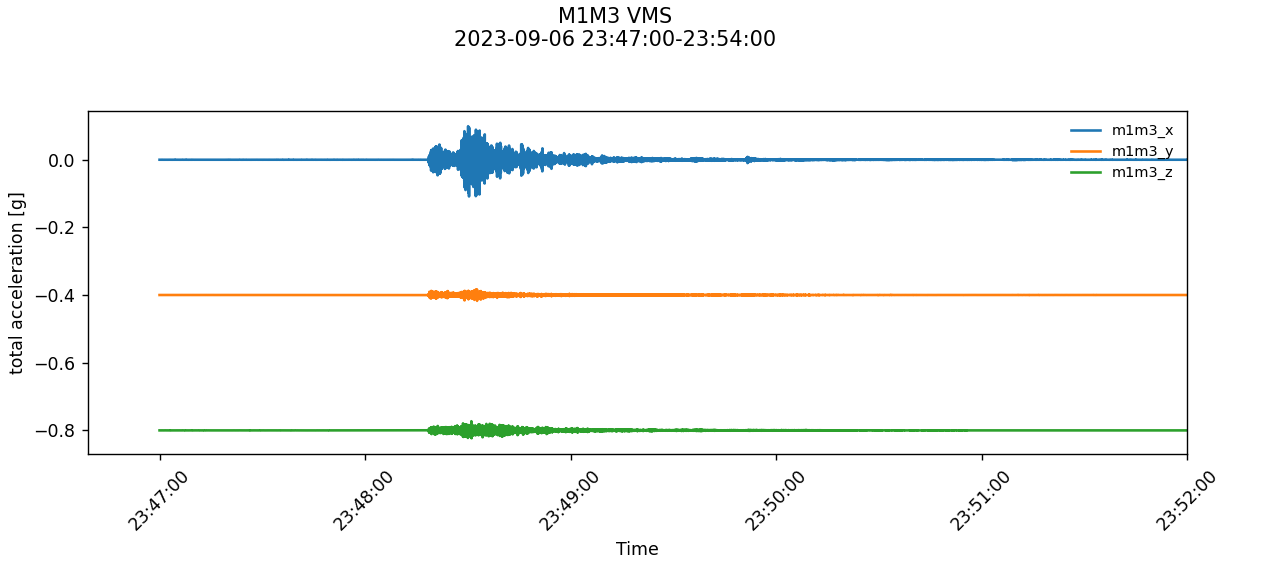 The limit required to keep the mirror safe during a mag 6 earthquake must be less than 3000 N. To study this we have to analyze the HP forces along the same axes and compare it with the accelerations.
Unfortunately, we cannot do this analysis because the telescope was stationary and there is no TMA information for 2023.09-06.
PSD (Power Spectral Density)#
We are going to analyze the Power Spectral Density
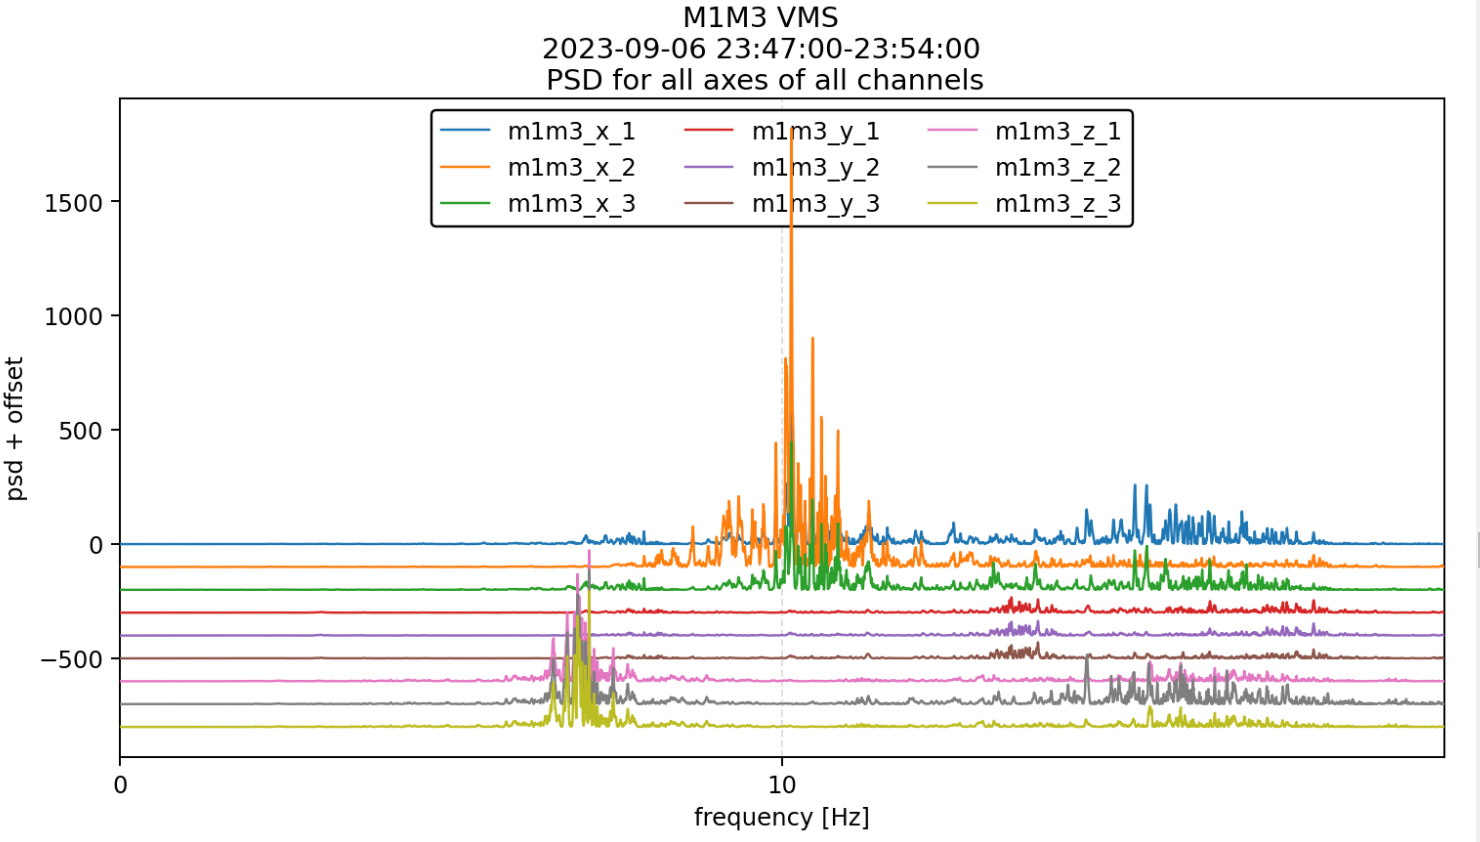
2.1. A Power Spectral Density (psd) of each axis (xyz) of each channel of the m1m3 vms data
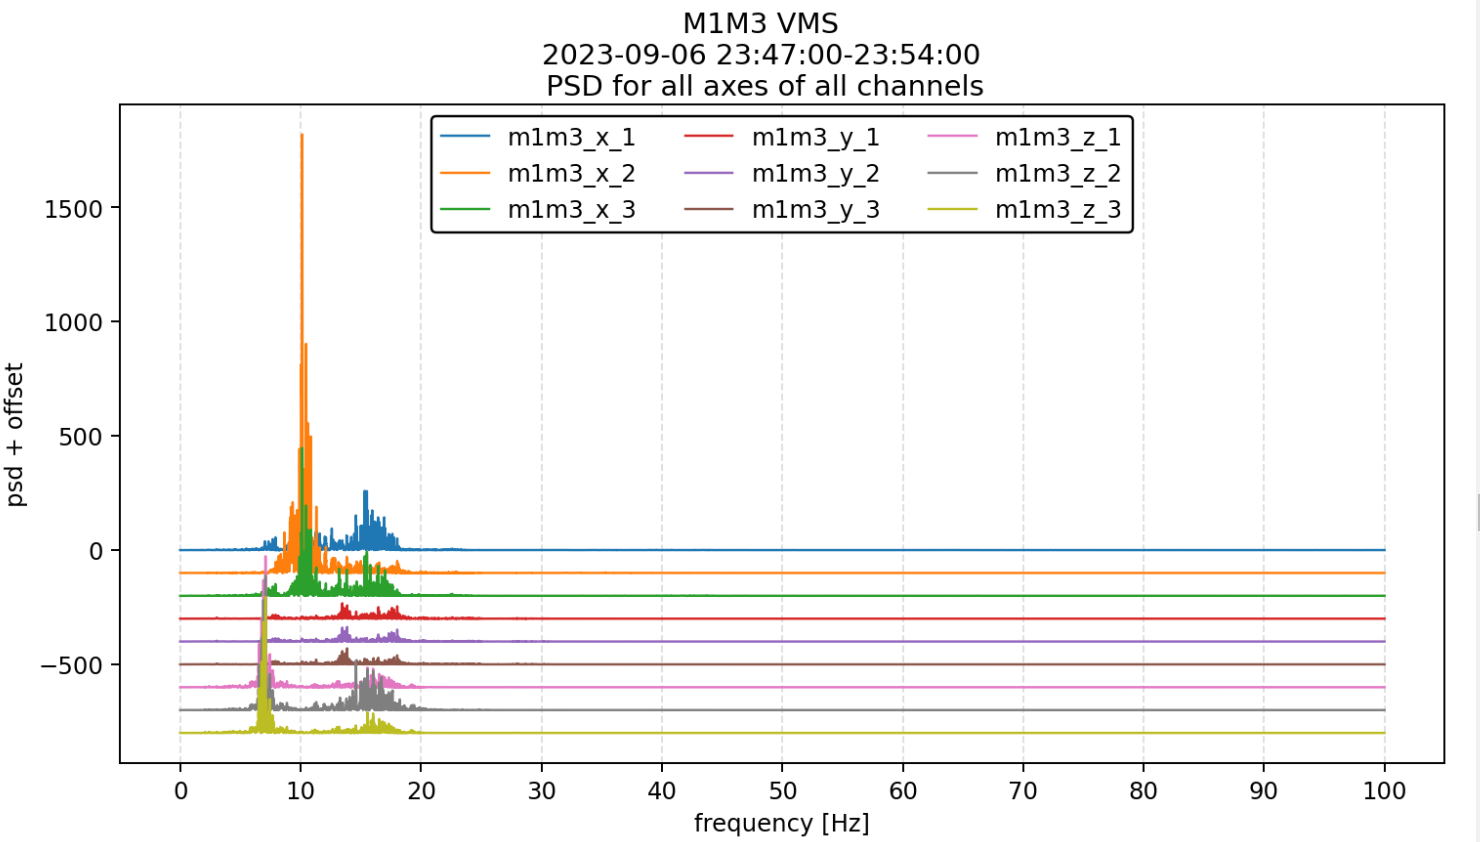
We change the x-axis to better visualise the data.
Analysis for the evening’s event: 2023-10-31#
Unfortunately, for the second night to be analyzed, 2023-10-31, where there was an earthquake event with mag~6, no information is available. Therefore, it is not possible to make any kind of analysis.